7 October 2026
The building matters more than the market
By Phillip Haeder
Grey Lynn, Freemans Bay, Ponsonby, Herne Bay and St Marys Bay. 24 months to August 2026. Apartments only, no houses or townhouses.
The short version
- 214 apartment sales across 65 buildings in the 24 months to August 2026. Split down the middle, that is 107 sales in each 12 month half, or about nine a month. The count did not change at all between the two halves.
- Average price per square metre finished 0.8% higher on the raw numbers. Hold the mix of building ages steady and it is 0.3% lower. Either way, flat.
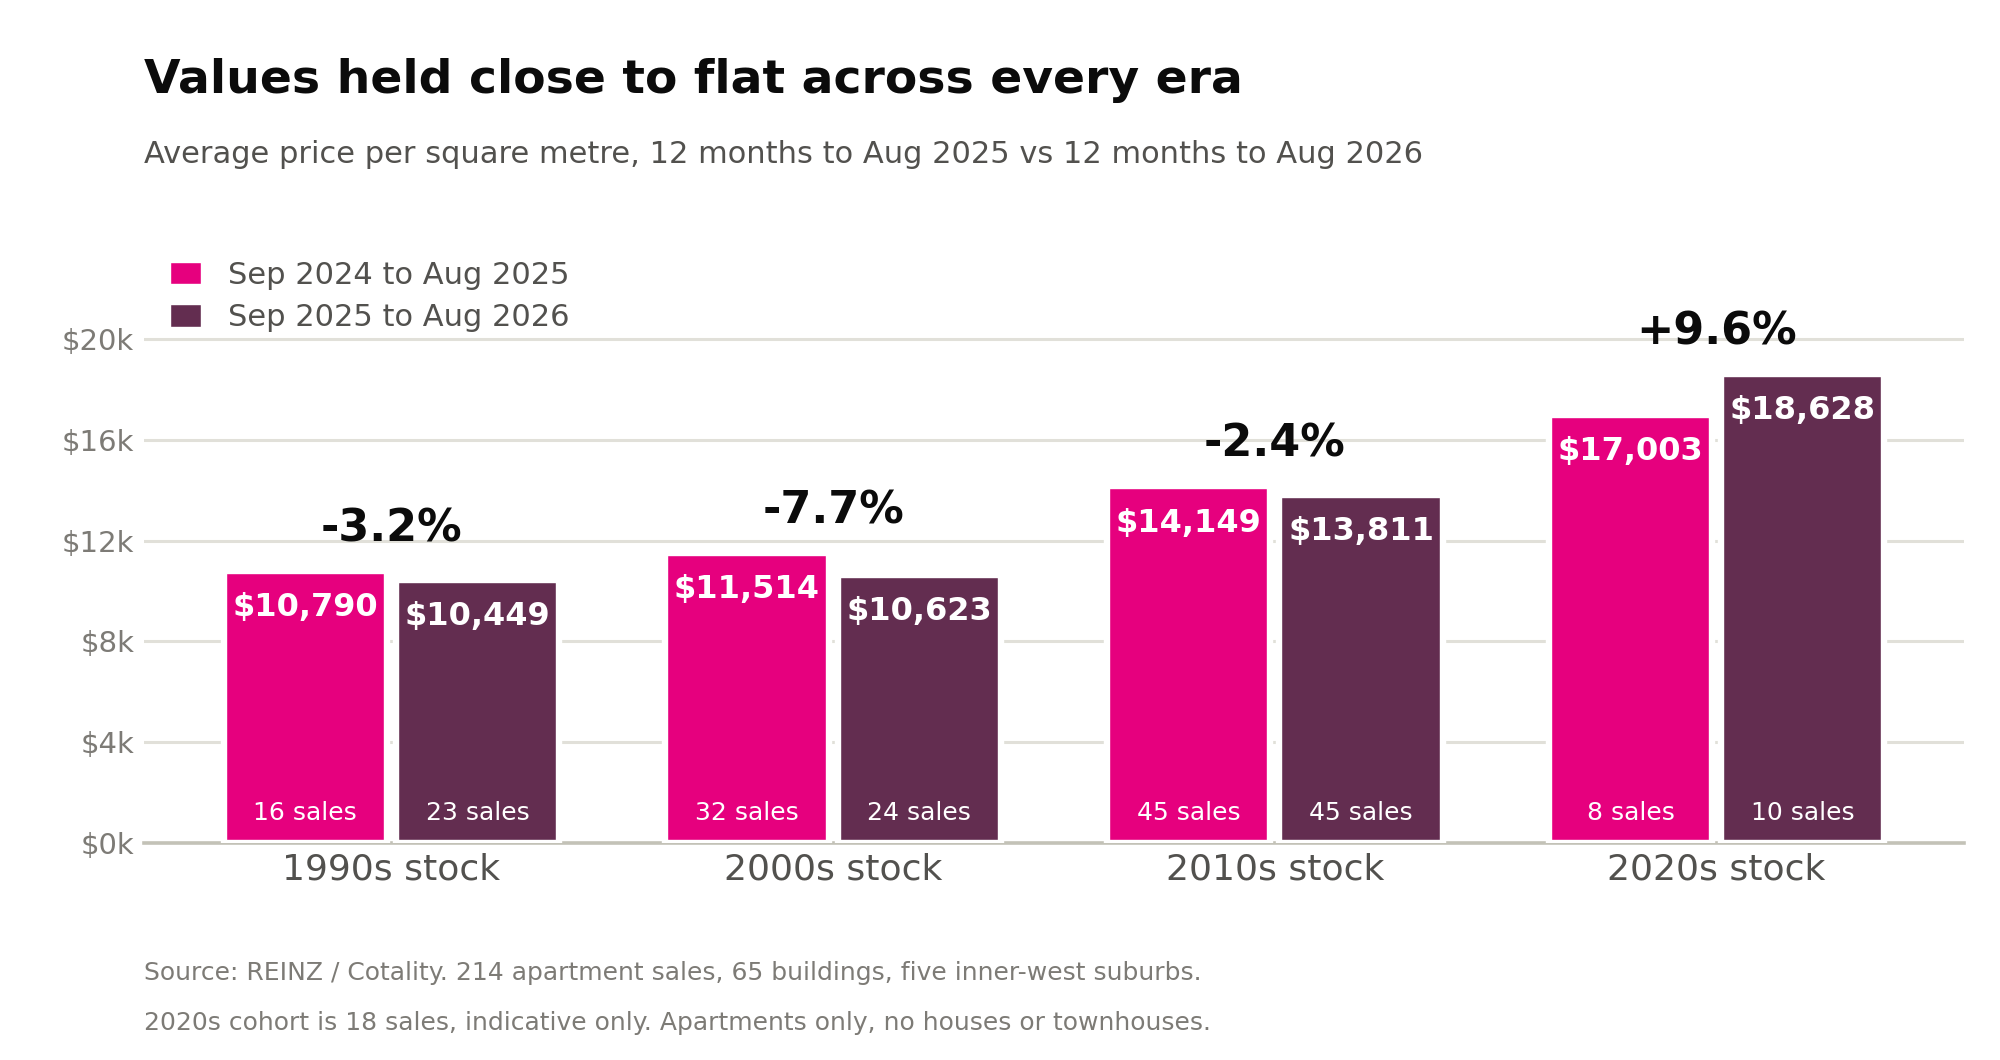
- Every decade of stock with a workable sample landed between 7.7% down and 2.4% down. The exception is 2020s stock, up 9.6%, on 18 sales in total.
- Sales above their rating valuation fell from 59% to 41%. Measured against the same fixed benchmark, that is roughly 3% of softening.
- The spread between buildings is far wider than the change over these two years. Two Freemans Bay buildings of the same decade, with much the same unit size, averaged $15,312 and $9,940 per square metre over the same 24 months.
Values held flat
The most useful way to read an apartment market is by the decade the building went up, because a 1998 block and a 2018 block are different products that happen to share a postcode. Grouping the sales that way, and comparing the 12 months to August 2025 against the 12 months to August 2026, this is what came out.
| Decade built | Sales 24/25 | Avg per sq m 24/25 | Sales 25/26 | Avg per sq m 25/26 | Change |
|---|---|---|---|---|---|
| 1990s | 16 | $10,790 | 23 | $10,449 | -3.2% |
| 2000s | 32 | $11,514 | 24 | $10,623 | -7.7% |
| 2010s | 45 | $14,149 | 45 | $13,811 | -2.4% |
| 2020s | 8 | $17,003 | 10 | $18,628 | +9.6% |
| All stock | 107 | $13,257 | 107 | $13,368 | +0.8% |
| Mix adjusted | 107 | $13,311 | 107 | $13,268 | -0.3% |
The 2020s row is 18 sales in total and is indicative only. Eleven further sales in pre-1990 buildings are covered separately below.
Why the mix adjustment matters
The raw average says values rose 0.8%. That number is only as good as the buildings that happened to trade. In the recent 12 months a larger share of sales came from 1990s stock, which sits at the cheaper end, and a smaller share from 2000s stock. Holding the mix of decades constant across both periods removes that distortion, and the answer becomes 0.3% lower rather than 0.8% higher.
The gap between those two numbers is about one percentage point. That is small. In this dataset the mix effect is real but minor, and the fair conclusion either way is that apartment values in these five suburbs went sideways over two years.
Where each era of building sits
Pooling all 24 months gives a cleaner read on the steps between eras. Owners use this to place their own building.
| Decade built | Sales | Avg per sq m | Median floor area | Against 1990s | Step from decade before |
|---|---|---|---|---|---|
| 1990s | 39 | $10,589 | 55 sq m | baseline | |
| 2000s | 56 | $11,132 | 70 sq m | +5.1% | +5.1% |
| 2010s | 90 | $13,980 | 67 sq m | +32.0% | +25.6% |
| 2020s | 18 | $17,906 | 88 sq m | +69.1% | +28.1% |
The big step is between 2000s and 2010s stock, not between 2010s and 2020s. Roughly a quarter more per square metre, for a building maybe a decade newer.
Pre-1990 stock sat apart from all of this. Eleven sales averaged $21,094 per square metre, but that cohort is almost entirely large apartments in Herne Bay and St Marys Bay, including three Sarsfield Street sales between $7,000,000 and $8,000,000. It is not comparable with the rest and is excluded from the decade table above.
Suburb by suburb, with building age in view
Comparing suburb averages without checking building age produces nonsense. Herne Bay looks like the dearest apartment market in the group at $22,315 per square metre, but its median apartment was built in 1990 and runs to 124 square metres. It is a different product.
| Suburb | Sales | Buildings | Median year built | Avg per sq m | Avg per sq m, 2000s and 2010s only |
|---|---|---|---|---|---|
| Grey Lynn | 112 | 36 | 2009 | $12,197 | $11,910 |
| Freemans Bay | 66 | 11 | 2014 | $12,731 | $13,949 |
| Ponsonby | 16 | 8 | 2010 | $14,457 | $15,807 |
| Herne Bay | 12 | 7 | 1990 | $22,315 | too few |
| St Marys Bay | 8 | 3 | 1980 | $17,939 | too few |
Ponsonby, Herne Bay and St Marys Bay each sit at or below 16 sales and are indicative only. The final column covers 86 Grey Lynn sales, 49 Freemans Bay and 11 Ponsonby.
Once building age is held steady, the raw picture reverses. On all stock Grey Lynn and Freemans Bay look close, $12,197 against $12,731. Restrict both to 2000s and 2010s buildings and Freemans Bay comes out roughly 17% dearer per square metre. Grey Lynn simply has more older stock in the mix. These are not one market with two postcodes.
Over the two periods, Grey Lynn was 1.9% higher on raw numbers and 2.1% lower once mix adjusted. Freemans Bay was 8.8% lower raw and 2.9% lower mix adjusted. The large raw fall in Freemans Bay is mostly a change in which buildings sold, not a fall in what any given apartment is worth.
The gap between buildings is the real story
Everything above moves within a few percent. The differences between individual buildings do not. Below are four of the seven 2010s buildings with at least seven recorded sales: the three that sold furthest above the 2010s average, and the one furthest below.
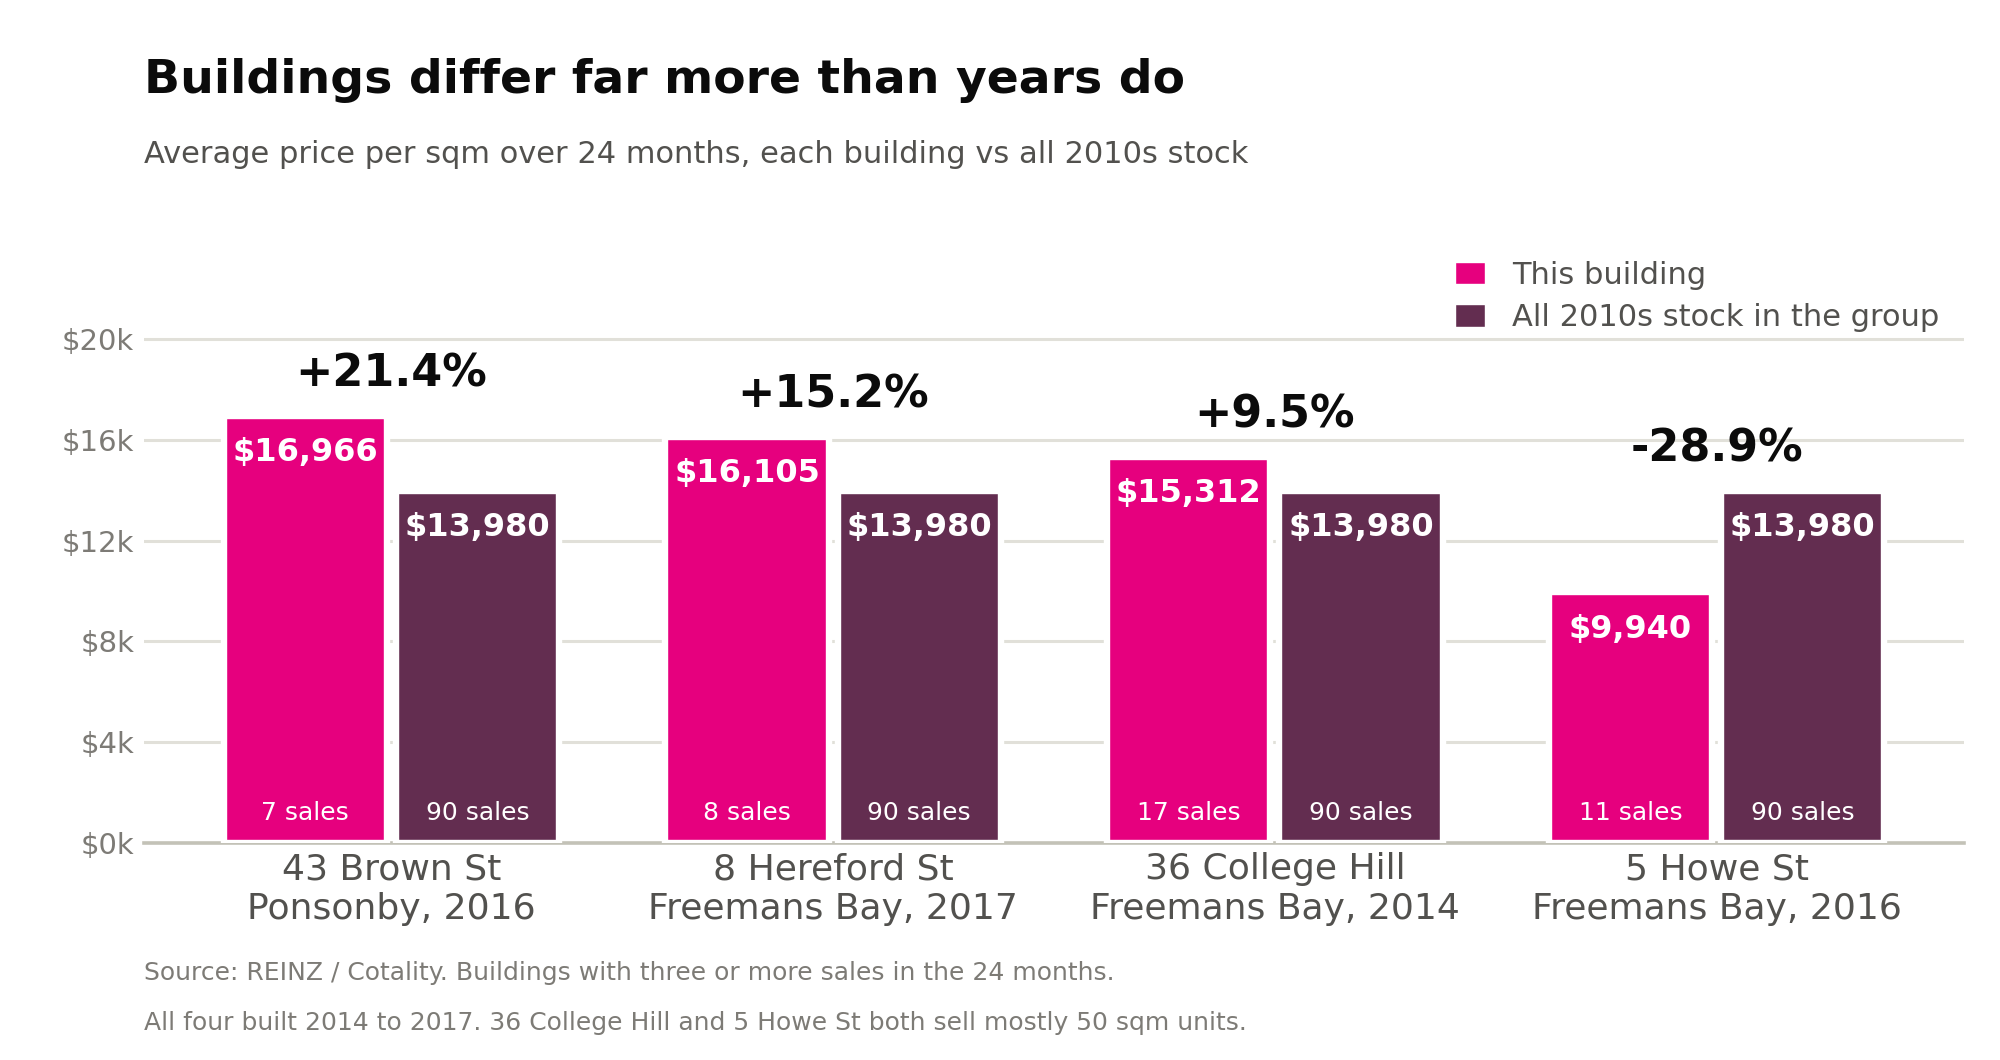
36 College Hill averaged 9.5% above its decade and 5 Howe Street 28.9% below. Both are in Freemans Bay, both went up in the 2010s, and both sell mostly 50 square metre units. 36 College Hill averaged $15,312 per square metre and 5 Howe Street $9,940, a gap of about 54%. Over the same two years, average price per square metre across the whole group moved less than 1%.
Auckland Council reached the same conclusion. The rating valuations behind those two buildings work out at roughly $14,200 and $10,200 per square metre, a gap of 39%. Narrower than the sale figures, but pointing the same way.
What separates them is the sort of thing a spreadsheet cannot show you: the build quality, the outlook, the body corporate, the car parking, the way the building has been maintained. That is where your value actually lives, and it is why a suburb median is a poor guide to what your own apartment is worth.
One building, seven sales, the same floor area
36 College Hill in Freemans Bay recorded 17 sales over the 24 months, the most of any building in the group. Seven of them were 51 square metre units, which makes for an unusually clean comparison.
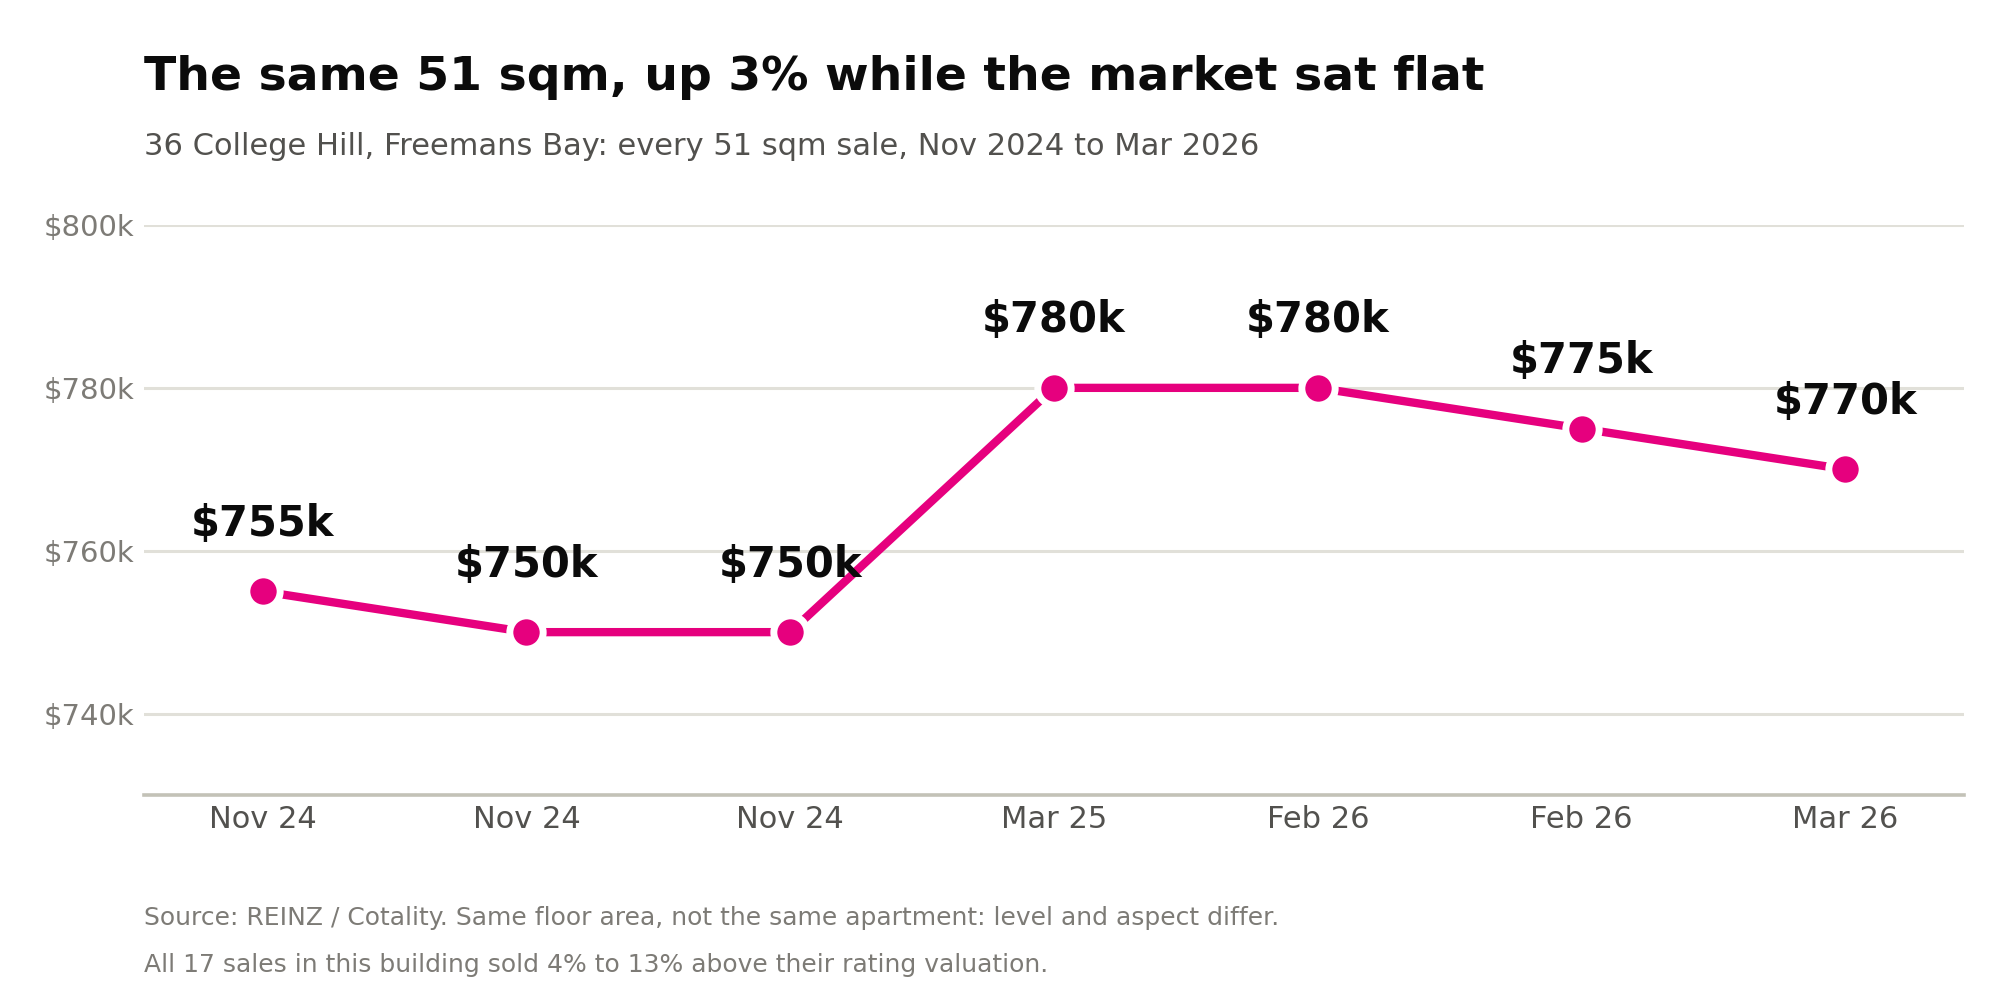
Three sold in November 2024 at an average of $751,667. Three sold in February and March 2026 at an average of $775,000. That is 3.1% higher over roughly sixteen months, in a market that went sideways.
These are the same size, not the same apartment. Floor level, aspect, condition and whether a car park came with it all differ, and they explain most of the spread inside that range. The pattern still holds. All 17 sales in the building went through between 4% and 13% above their rating valuation, and not one sold below it.
What data was removed from the analysis and why
The export held 266 records. 52 were removed before any figure in this report was calculated.
| Removed from the figures | Sales |
|---|---|
| Bulk transaction at 221 Great North Road: 16 separate units each recorded at the single $13,345,000 consideration. As these have settled now, we can see that a large developer / property investor has made this purchase and some of these apartments have been advertised for rent under their brand. | 16 |
| Sale type recorded as "Multi", including four units at 17A Crummer Road sharing one $3,991,000 price | 17 |
| Pending settlement advice: seven undisclosed prices, one unsettled | 8 |
| Nil or nominal consideration: three at $0, one at $40,000, one at $75,000 against rating valuations of $530,000 to $2,300,000 | 5 |
| Quest Hotel serviced apartments at 70 Ponsonby Road, held on a hotel management agreement | 3 |
| Whole block sold as one holding: 32A Arthur Street, 612 square metres | 1 |
| Non-arm's length: 3A/444 Great North Road at 28% of its rating valuation, and 504/9 Hopetoun Street at 34% | 2 |
| Total removed | 52 |
| Sales used in this report | 214 |
At 221 Great North Road, sixteen apartments of different sizes, sold on sixteen different dates, each carried a price tag of $13,345,000. That is one purchase of sixteen units recorded against every title. Left in, it would have pushed the average price per square metre for 2000s stock from $11,132 to well over $100,000 and made this report worthless.
Before you buy into any building, read the body corporate minutes and find out what you are actually buying.
The wider market, for context
REINZ recorded a national median sale price of $750,000 in August 2026, down 1.3% on August 2025, with 5,430 sales, down 13.0%. The House Price Index was down 0.9%. Properties took a median of 51 days to sell, three days longer than a year ago, and national inventory rose 9.7%.
The Auckland region median was $950,000, exactly level with August 2025. Auckland sales numbered 1,642, down 15.3% year on year. The median time to sell was 54 days against a ten year August average of 43. REINZ reported first home buyers as the most active group, developers less active, and salespeople expecting broadly steady conditions.
Those REINZ figures cover every property type across the whole Auckland region, houses included. They cannot be read against the apartment numbers in this report. They are here to show the direction of the wider market, nothing more.
One point that cuts the other way and is worth noticing. National sales volumes fell 13.0% and Auckland fell 15.3%. Apartment sales in these five suburbs did not fall at all: 107 in each 12 month half. Different source, different measure, so it is not a like for like comparison. But volume in this segment held up while the wider market thinned out. It is worth noting that these are highly desirable city fringe suburbs. Apartment sales volumes in the city centre would paint a very different picture.
Borrowing costs are going the other way
The major banks repriced fixed mortgage rates higher through August 2026. On 2 September the Reserve Bank raised the Official Cash Rate to 2.75% and said it may need to raise it further this year.
Anyone holding off on the assumption that money is about to get cheaper is working from last year's picture. That is not a reason to do anything in particular. It is a reason to check the assumption before you build a decision on it.
What this means if you own an apartment here
Values went sideways for two years while sales volumes held steady. About nine apartments a month changed hands across 65 buildings, in every decade of stock and at every price from $320,000 to $10,275,000. Apartments in these suburbs are selling.
The suburb average is close to useless for working out what yours is worth. The table of averages by decade will get you closer, and you can run the numbers against your own floor area. But the real answer sits in your own building's sales, and the gap between a good building and an ordinary one of the same age dwarfs anything the market did over these two years.
So here is an offer worth taking up. Send me your address and I will send you every sale recorded in your building over the last 24 months: unit, floor area, year built, sale price, price per square metre and how each one landed against its rating valuation. It takes me about ten minutes to pull, and it will tell you more than any suburb median can.
Renting it out rather than selling?
Not everyone reading this is selling. If you are weighing up holding the apartment and letting it instead, the same building level detail applies to rents, and we manage properties across these suburbs as well as selling them. Happy to give you a rental figure alongside the sale figure so you can compare the two properly. Ask for both and you will get both.
Data from Cotality / Property Guru records of reported apartment sales from 3 September 2024 to 17 August 2026, across the suburbs of Grey Lynn, Freemans Bay, Ponsonby, Herne Bay and St Marys Bay, for apartment property types only. 214 sales used, from 266 records, after the exclusions listed above. Wider market figures from REINZ for August 2026. Rating valuations are Auckland Council figures set at 1 May 2024 and released in June 2025. Sales are reported unconditional sales for the period, not a live valuation. General market information only, not financial advice.
Thinking about your next move?
Book a free, no-obligation appraisal and let's talk it through.
Book a Free Appraisal